Analyzing Summary Variables in the Presence of Partially Missing Longitudinal Data
Jennifer L Thompson, MPH
Rameela Chandrasekhar, PhD
Vanderbilt University Medical Center
bit.ly/jlt-jsm2018
jenniferthompson/MissSumVars
@jent103
Our Motivation

- Work with a research group which focuses on all aspects of critical illness, including the aftermath
- Many projects involve both in-hospital and long-term components, and we want to investigate association between some exposure during the hospitalization and an outcome that takes place a year or more later
- Here, we have a patient who was hospitalized for five days, had the exposure of interest on three days and no exposure on the other two
Our Motivation

Our Motivation

Is more delirium (in-hospital brain dysfunction) associated with scores on a cognitive test after hospital discharge?

Then we might want to somehow summarize that exposure and see if it's related to some long-term outcome. This could include
- Cognitive or functional impairment
- Quality of life
- Mortality
SLIDE
BRAIN-ICU cohort:
- published in 2013
- interested in whether the amount of delirium a patient experienced in the hospital was associated with performance on a test of cognitive ability up to a year after they were discharged
Other possible examples:
- More severe sepsis -> higher rate of long-term death among survivors?
- Average (min, max) severity of illness related to functional outcomes?
The Problem
Prospective cohort
 BRAIN-ICU Cohort Study, NEJM 2013
The Problem
Prospective cohort
 BRAIN-ICU Cohort Study, NEJM 2013
Retrospective EMR
Describe visdat:
- From BRAIN-ICU study
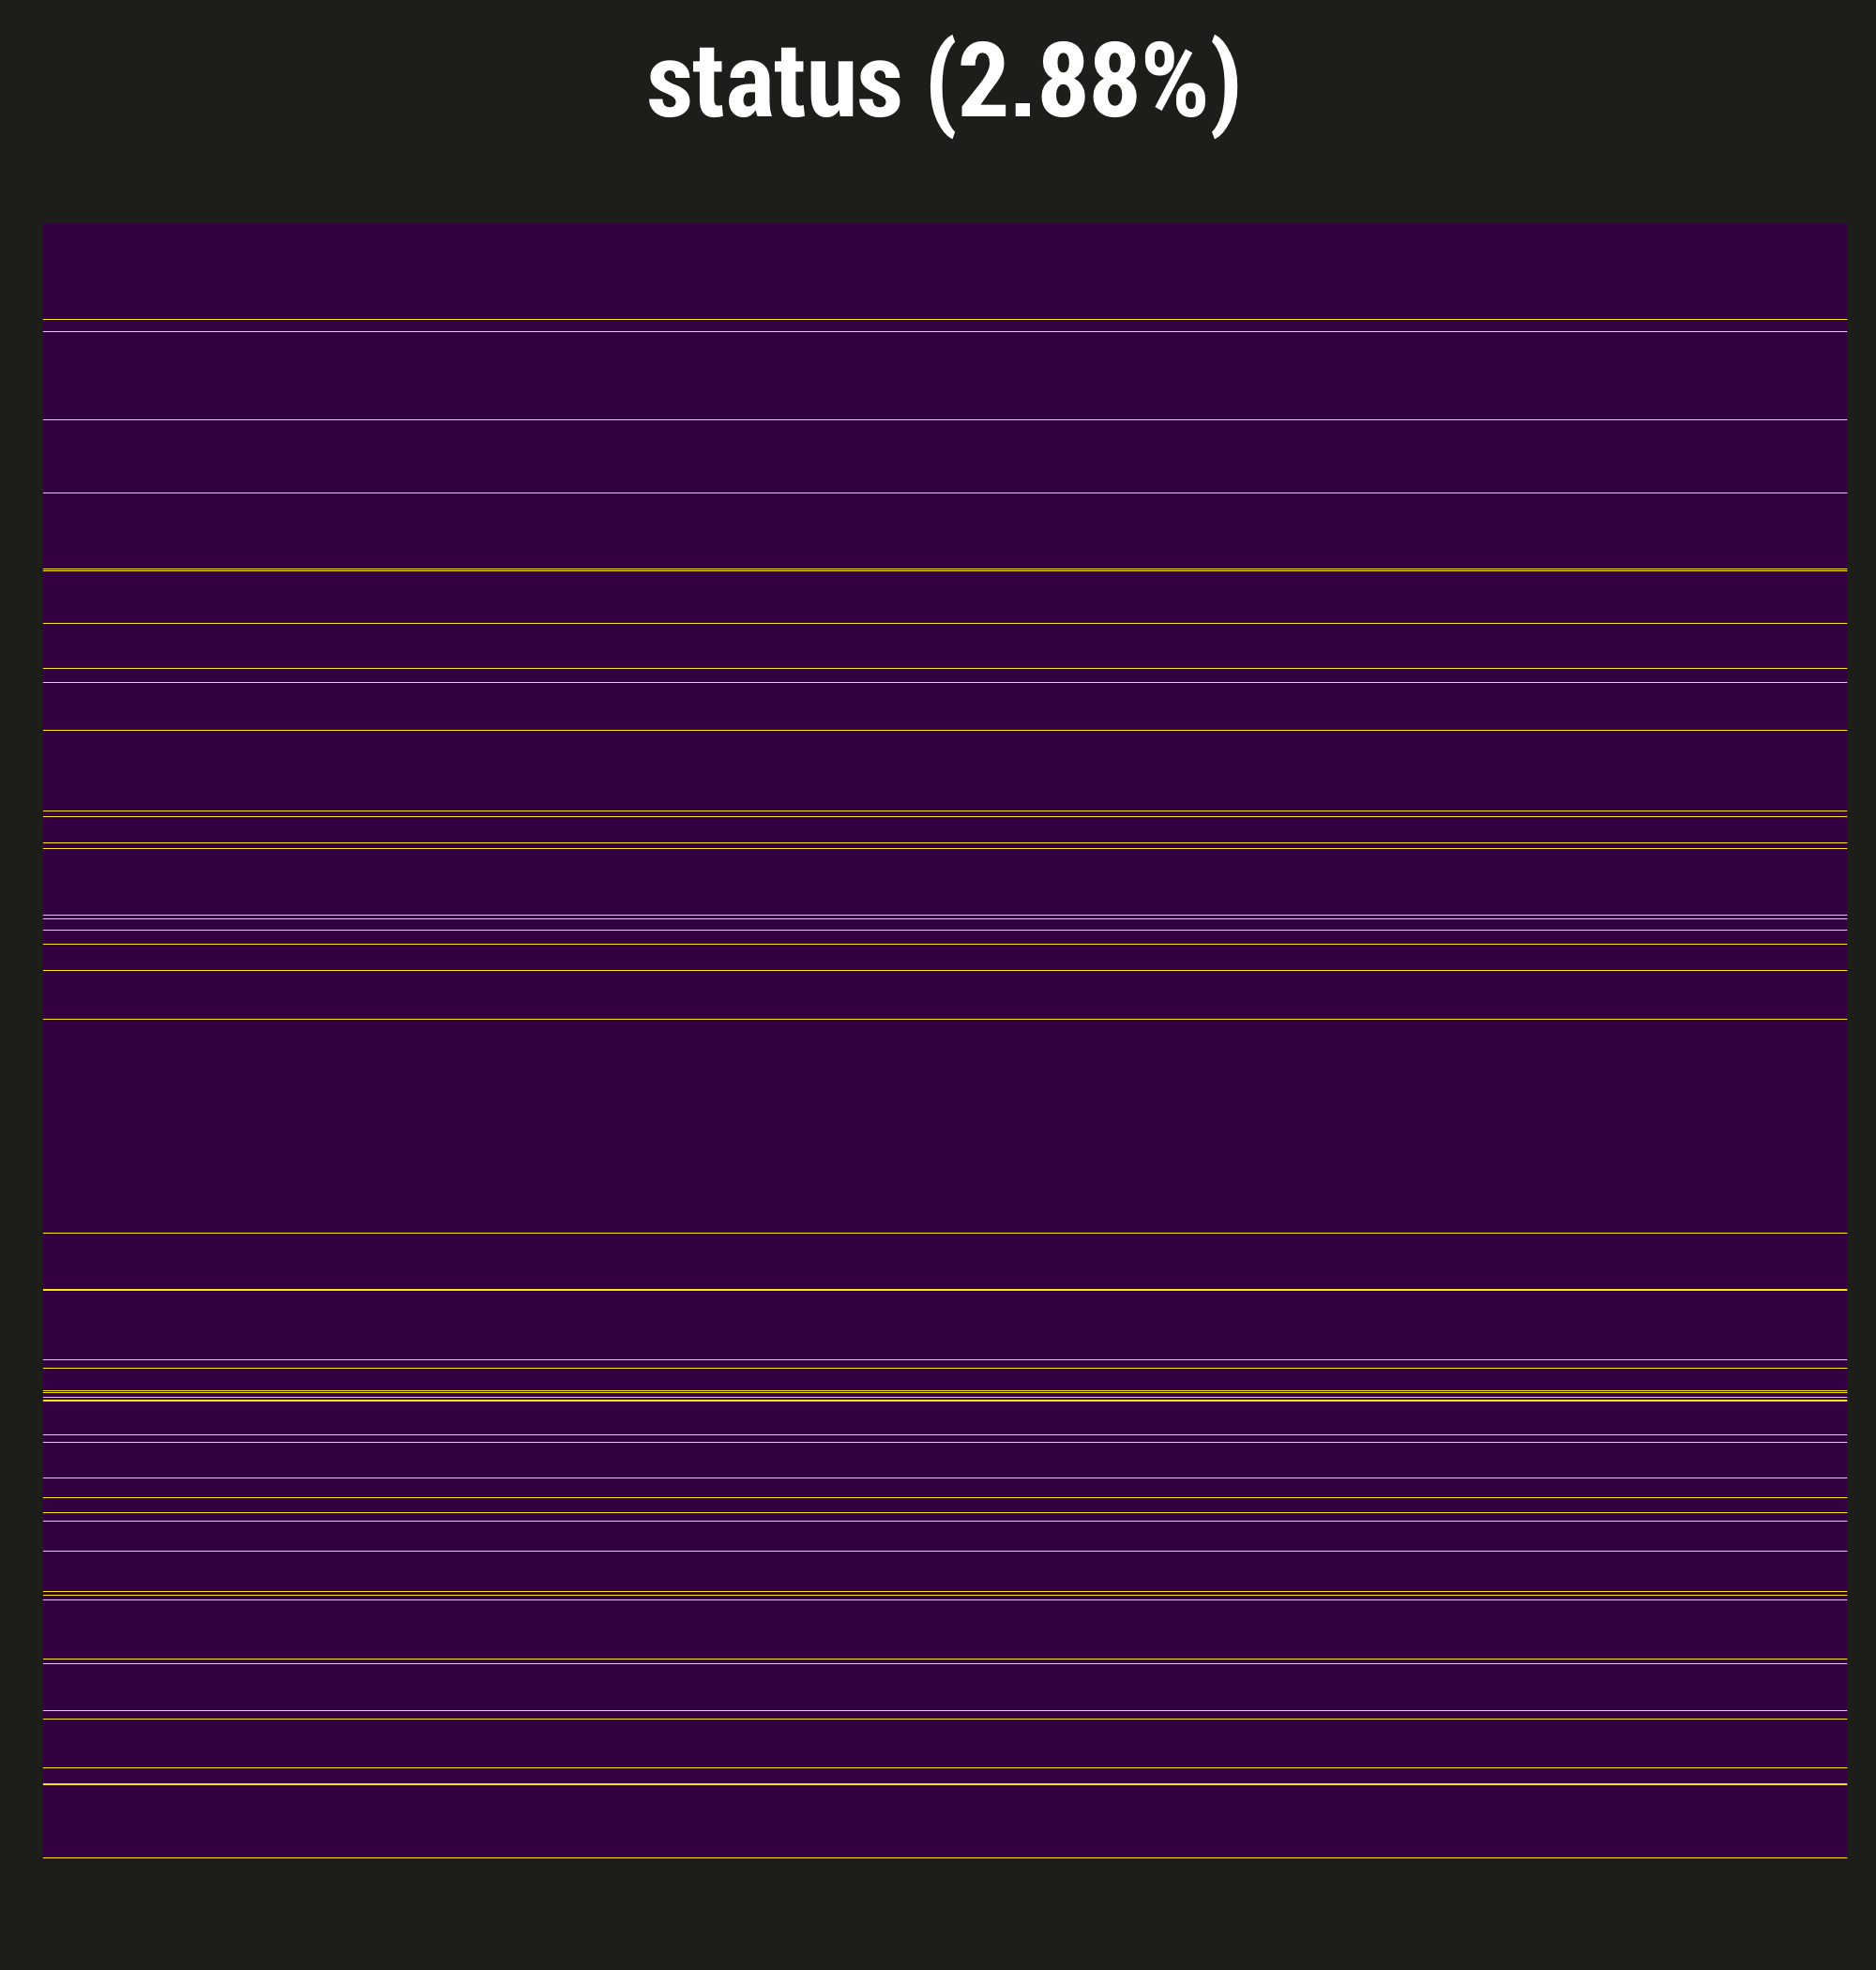
- Purple = not missing, yellow = a day with no delirium assessment
- Low proportion of patient-days missing
- This is often the case for our prospective studies, thanks to our excellent staff of research coordinators
- Reason to believe missingness or more or less completely at random - patient in a procedure, for example
- So in BRAIN we did single imputation to "fill these in" and summarize our exposure, but not a big deal; little worry about bias
And then...
- Interested in a retrospective study using EMR data in a trauma unit, same exposure (different outcomes)
- Delirium assessments are done, but not as often as in medical or surgical units
- change slides
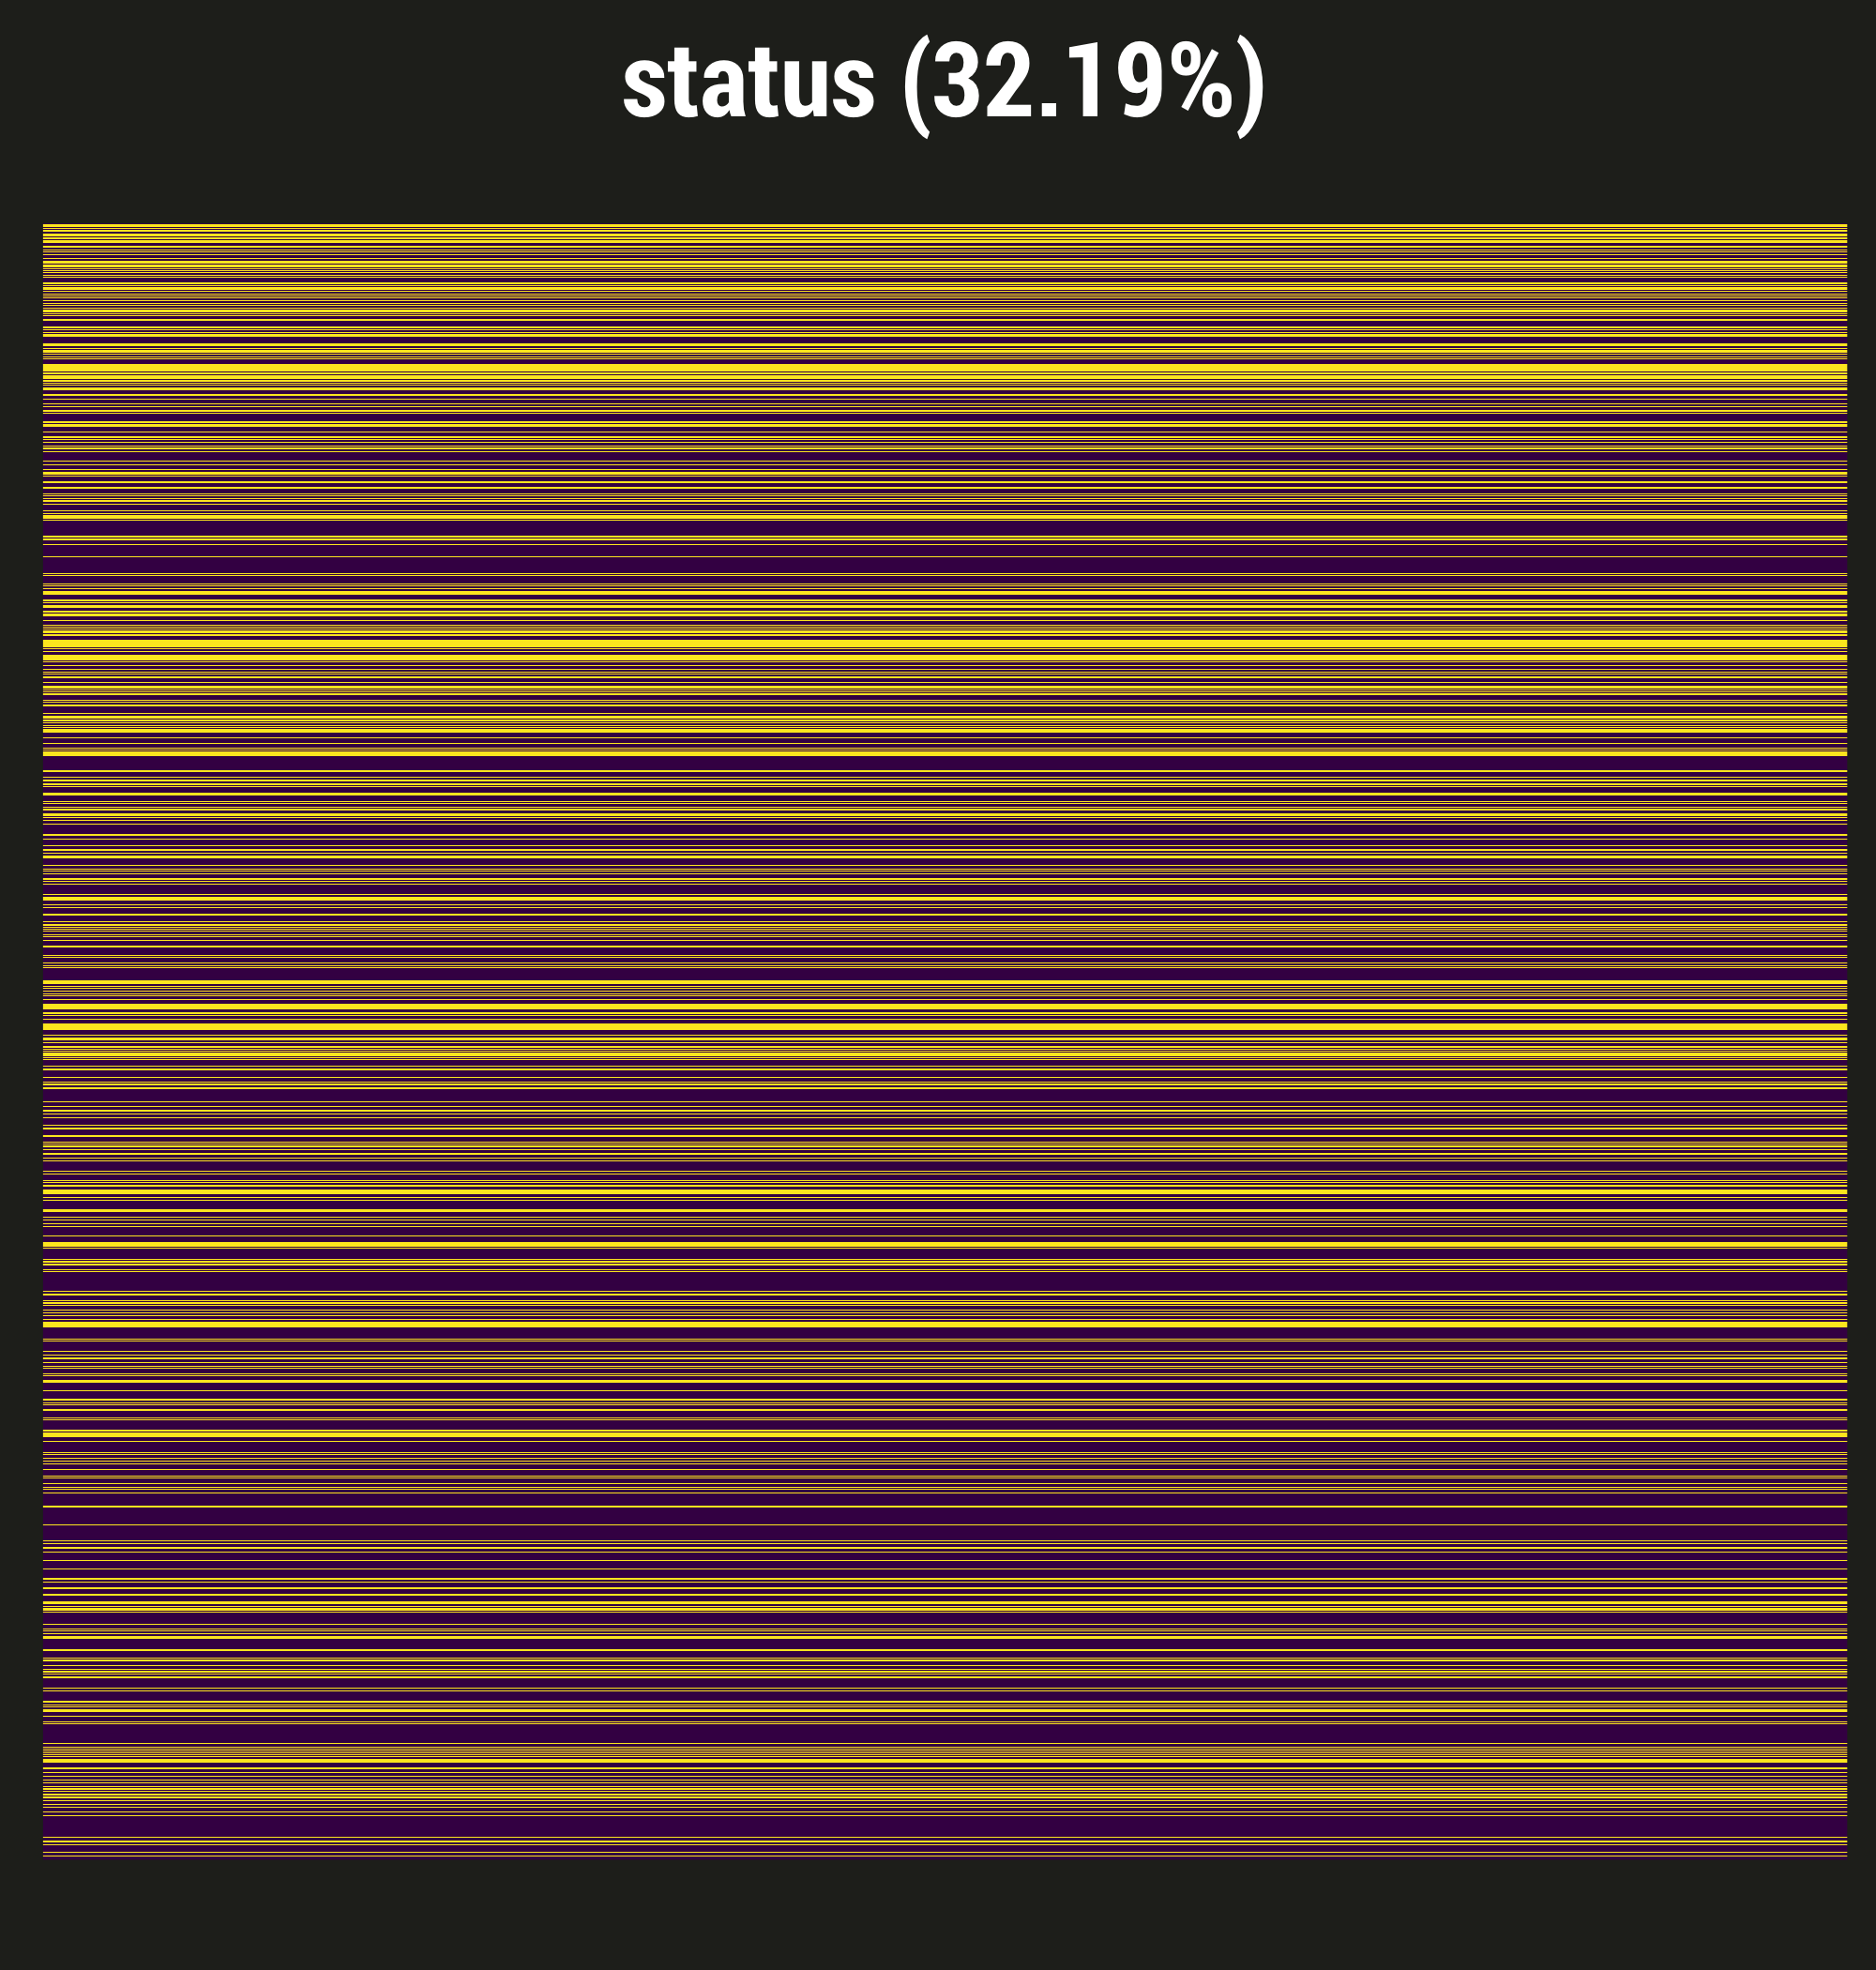
- In fact, nearly 1/3 of our in-hospital days are missing the delirium assessment
- This missingness is almost certainly NOT at random
- Severely ill patients might be ventilated, comatose; perhaps staff didn't think assessment was necessary, but we can't necessarily tell that they were comatose from the data
- Alternately: less sick patients who are up, walking, having conversation may also not have gotten assessed, because the staff thinks it's clear that they're fine
- In other words, using data collected for clinical purposes for research has challenges!
So, how to deal with the missingness in the way that gives us least bias?
Four strategies:
Strategies: Simple
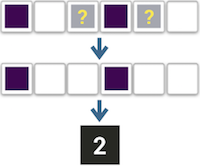
Assume the "best"
NA = unexposed:
Only count the exposure we know about
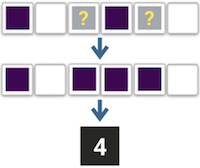
Assume the "worst"
NA = exposed:
All missing time points get exposure
Pros: Straightforward to implement; plausible, if we know a lot about data collection
Cons: Prone to bias
In our case, the exposure is usually bad, so I've called our first strategy assuming the best: We only count the exposure we know about, and assume all the missing days have no exposure. For example, here we have a patient with two known days of exposure, so that's what they get - we ignore these two missing days.
Of course, we can also assume the worst, meaning that we assume every missing day does have the exposure. So here our hypothetical patient would get a value of four.
These approaches are straightforward to implement, and in certain cases they might make a lot of sense. For example, we use an organ dysfunction score which incorporates bilirubin levels, but even in our prospective studies, bilirubin is generally not measured every day unless it's clinically helpful. Working with our clinical collaborators, we've usually decided that a missing bilirubin means there was no clinical reason to suspect liver dysfunction.
But of course, if you don't know for certain whether or how your missingness is informative, these approaches can be quite prone to bias.
Strategies: Imputation
Assume nothing
- If subject missing any time point,
entire summary value =NA - Multiply impute missing summary values
before modeling
Pros:
- Fairly simple to implement
- Acknowledges uncertainty
Cons:
- Ignores the data we do have
- Likely to overestimate uncertainty
Of course both of those approaches make some pretty big assumptions, so in this next approach we could assume nothing: If the patient has even one missing value, we can't know for certain what the overall summary value would be, so we consider that whole value missing.
In this case, we use multiple imputation prior to regression modeling; in this example, I've "used" five imputations, and our patient gets values all over the map. This might be OK if we have good covariate data with which to impute, and lots of missing patient-days; it is pretty straightforward to implement, and it at least acknowledges the uncertainty, which our simple approaches do not.
However, it's essentially throwing out all the data we do have available - in this case, these four patient-days where we know the exposure value count for nothing. And while it at least acknowledges the uncertainty, this approach will likely overestimate it.
Strategies: Imputation
Assume the minimum
- Multiply impute missing time points
- Summarize each imputed dataset
- Use these imputed summary
datasets when modeling
Pros:
- Maximizes use of data we have, including available covariate information
Cons:
- Computation time
- Data wrangling
In our final approach, we try to assume as little as possible, using the data from the days we know about and imputing at this lowest hierarchy the days we don't. Once we've multiply imputed missing patient-days, we summarize each of those imputed datasets, then use those summarized datasets in multiple imputation when we model.
This approach, of course, maximizes the use of the data that we have available, including daily covariate data to help predict our missing values. But it's the most computationally intensive approach, which can matter especially in large EMR studies, and may involve some gnarly data wrangling when you go back and forth between imputing and summarizing.
We assumed that this approach was our best bet; it makes intuitive sense. However, what kind of statisticians would we be if we didn't test that assumption and simulate some things? So that's exactly what we did.
Simulations
- 5%, 20%, 35%, 50% of patient-days missing exposure value
- Types of missingness:
- MCAR
- MAR
- Missingness in exposure weakly, moderately, strongly associated with daily severity of illness
- MNAR
- Missingness in exposure weakly, moderately, strongly associated with true exposure value
- True relationship with outcome: ranges from 0 to -5
- Imputation methods incorporate severity of illness
We used our BRAIN-ICU cohort data as our inspiration for these simulations, meaning that our exposure was daily delirium, yes or no, and our outcome is a simulated score of cognitive impairment.
We set a range of our individual patient-days to be missing, and set different types of missingness. For our exposures that were missing at random, we set a weak, moderate, and strong association between that missingness and a daily severity of illness score. For exposures that were missing not at random, we set a weak, moderate, and strong association between missingness and the true exposure value.
In the two methods which use imputation, we again used severity of illness to help predict either the overall duration of delirium, or delirium on a daily basis.
First I'll describe the setup:
- Our vertical panels = percent missing
- Horizontal panels = type of missingness, again with weak, moderate, or strong associations between missingness and either our covariate, for missing at random, or our true exposure, for missing not at random
- X axis = true association between exposure and outcome, smallest to largest
- Y axis = bias
- Colors:
- Yellow = all missing days are assumed to not have the exposure
- Green = assume all missing days do have the exposure
- Blue = Any patient with any missing day has their entire summary value imputed
- Purple = Impute all missing patient-days individually, then summarize and model with the summarized imputations
Main points:
- Note that only one row has a blue line. That represents our third approach, imputing the entire summary value when the patient has even one day missing. As we might expect, that approach performed really terribly; even at 5% missing, the bias there quickly outpaced any other approach. It turns out that once you have a decent amount of patient-days missing, this approaches forces so many overall summary values to be missing that it's just untenable, and we really couldn't justify the simulations with more missingness. So our first message is... don't do that.
- Obviously our bias gets worse as the amount of missingness increases, and is also worse when our exposure is not missing at random. No surprises there.
- When our data is missing completely at random, or missing at random, our daily imputation approach has the least bias.
- If we can't impute daily:
- Between the other two approaches, as missingness gets more prevalent, it looks like cynicism is actually paying off, since assuming all missingness gets the exposure is a little less biased than our optimistic approach.
- Once we have a relationship between the exposure and missingness, though, the winner changes. If there's a strong chance that missingness truly indicates the presence of the exposure - in other words, our missingness is quite informative - then using this "missing = exposed" approach is less biased than trying to impute, at least in our scenario.
Moving to standard errors, we see the same pattern with the imputation of the summary value - it's bad with very little missingness, and gets worse the stronger the actual effect size.
This slide is for those of you who prefer your variance estimates in terms of confidence intervals.
More generally, we see that assuming missingness indicates exposure leads to less variance to some extent than the other two methods. When data is missing at random or missing completely at random, there's not a lot of difference until you have a lot of missing data; but again, when missingness is substantially associated with the likelihood of the exposure, the difference becomes much more apparent.
Looking at coverage, the same patterns emerge:
- Imputing the summary value performs badly right out of the gate
- Imputing the daily value often outperforms the other methods
- The exception is when missingness is meaningfully associated with the true exposure, in which case assuming that missingness indicates the exposure is generally the winner
- With lots of missingness and a large true effect, none of them perform particularly well
This slide is very boring and is just here to show you that all the methods performed about equally well in terms of statistical power.
Examples with Motivating Data
- Duration of exposure vs outcome in two real-world studies, adjusting for one covariate
- Three strategies to summarize duration of exposure
Examples with Motivating Data
- Duration of exposure vs outcome in two real-world studies, adjusting for one covariate
- Three strategies to summarize duration of exposure
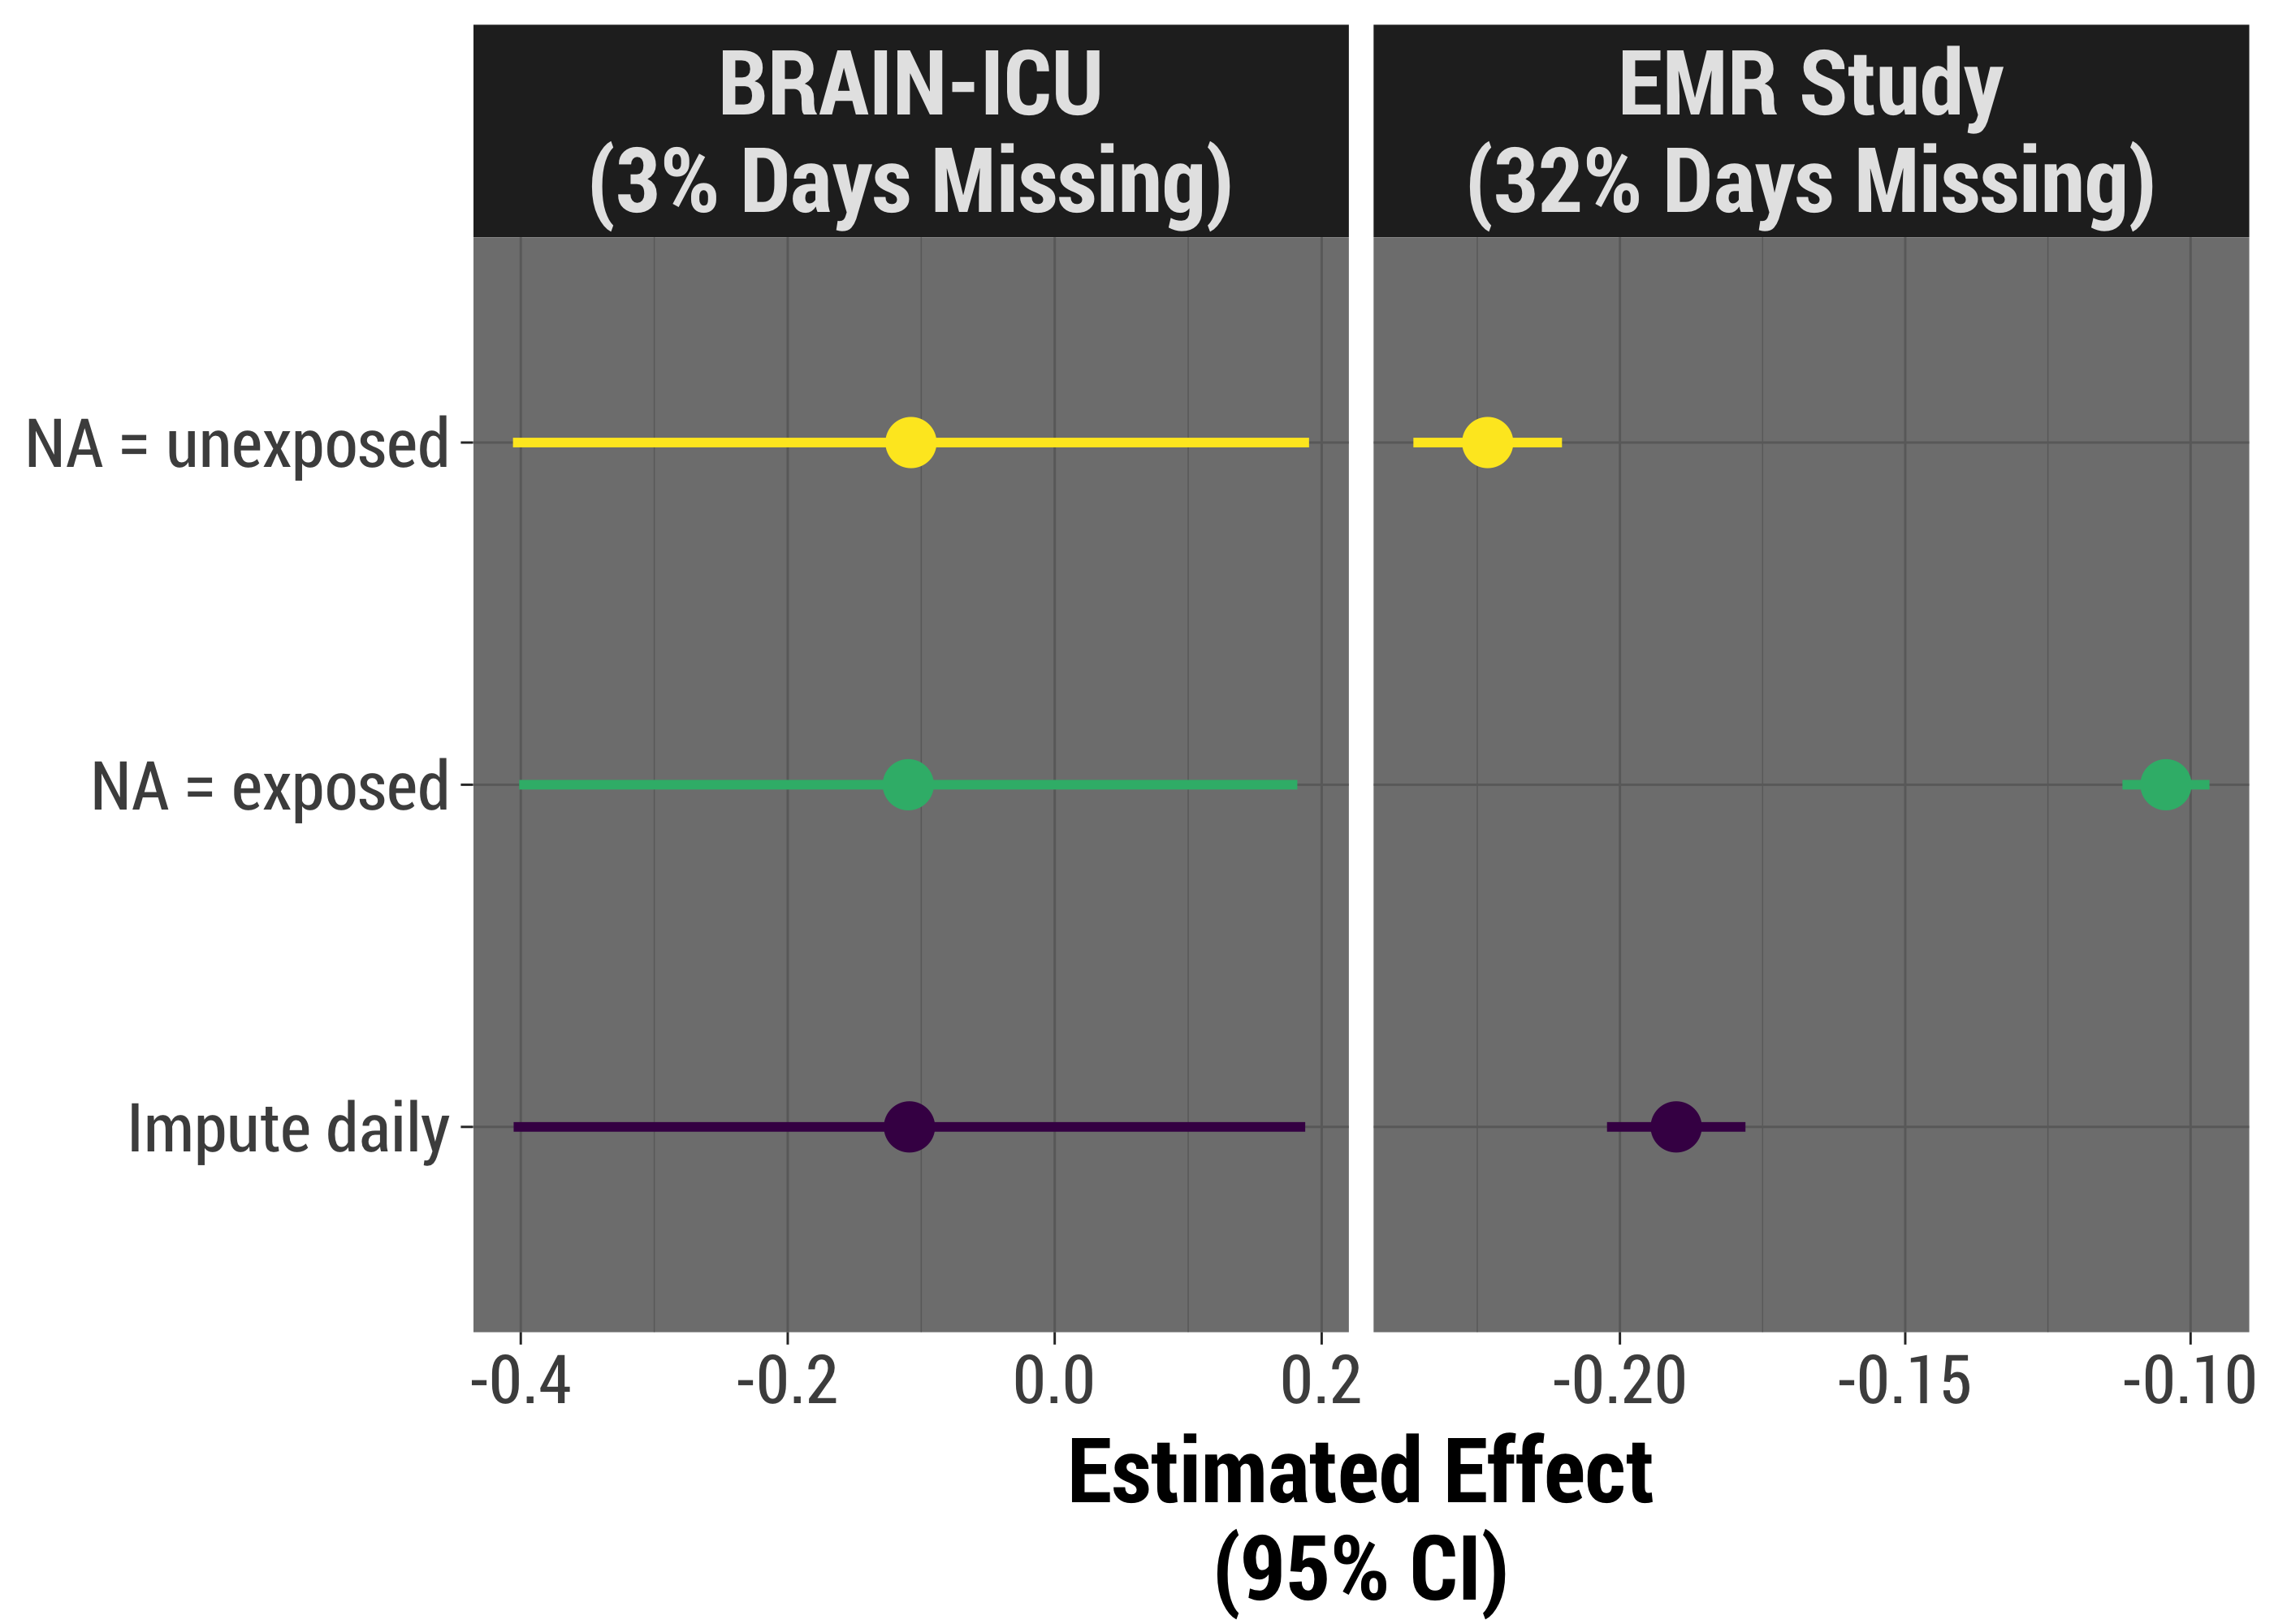
We're going to come full circle now, and apply each strategy to our two real-world studies. These analyses are simpler than we did in real life, but do adjust for severity of illness, which is likely a major confounder.
As we might expect, when there is little missing data, and it's likely to be missing more or less at random, our results look very, very similar. When we have more missingness, we can see that the results might be quite different. We can also see that there is less variance when we assume missingness is indicative of having the exposure, though it's likely that that result is biased.
Takeaways
- Understand your data and its missingness
- Better safe than sorry: imputing at the lowest level is usually worth it
- Don't
- Throw out data
- Ignore your missingness
Future Exploration
- Continuous exposure
- Complex relationships between covariates/exposure, missingness
- Understand your data and its missingness: When missingness is strongly indicative of the exposure, our advice on which method to use changes
- Better safe than sorry: imputing daily status indeed does seem most appropriate in most cases, and is likely worth the extra trouble. If you don't have a solid idea of why your data is missing, this is probably the best approach.
- Don't throw out your data: imputing the entire value when you have at least partial knowledge is a bad idea statistically; if unnecessary, disrespects the work done to give and collect that data
- Don't ignore your missingness: you can do better than just counting what you know about, especially if you know something about how and why data is missing
In the future, I hope to repeat these analyses with a continuous exposure, which has the added twist of being able to be summarized many different ways, and incorporating more complex relationships between covariates, exposures, and missingness. We purposely kept these straightforward, but as we all know, real life is not always that clear cut!
Acknowledgements
I want to thank a few R developers for making this work easier and more fun:
- Stef van Buuren - his mice package for multiple imputation has really incredible documentation and makes every step of the process accessible, making the imputation of daily values pretty painless
- Henrik Bengetsson and Davis Vaughn have built the future and furrr packages respectively, which work on parallel processing. These folks' work reduced my run time to probably 1/3 of what it would have been with very little additional effort on my part, and I'm very grateful.
- If you're interested in making your simulations or other long-running processes more fun, I would definitely recommend Brooke Watson's BRRR package, which made this work no faster but infinitely more enjoyable.
And of course, we'd love to thank the principal investigators and research staff at the Vanderbilt Center for Critical Illness, Brain Dysfunction and Survivorship, who come up with these ideas and work incredibly hard to design these studies and collect the data.
Finally, here's where you can find a link to these slides as well as the code I used for simulation and creating the slides and visuals.